4QFY2018 Result Update | Industrial Machinery
May 18, 2018
GMM Pfaudler Limited
Accumulate
CMP
`865
Performance Update
Target Price
`920
Standalone (` cr)
Q 4FY18
Q 4FY17
% yoy
Q 3FY18
% qoq
Investment Period
12 Months
Net sales
88
79
10.9
79
11
EBITDA
14
11
36.6
12
16.9
Stock Info
EBITDA margin (%)
16.4%
13.3%
308bps
15.5%
83.5bps
Sector
Industrial Machinery
A djusted PAT
Market Cap (` cr)
1,265
8.4
7.4
14.1
7.4
14
Beta
0.7
For Q4FY2018, GMM Pfaudler (GMM) posted a growth of 11%/14% yoy growth
52 Week High / Low
884/504
Avg. Daily Volume
5,837
in revenue/ PAT amid ~300 bps margin expansion. The company is seeing good
Face Value (`)
2
traction from its user industries like agrochemicals, which would drive 15-20%
BSE Sensex
33,597
revenue growth in next two years.
Nifty
10,682
Healthy order book: Q4’s top-line rose by 11% led by robust execution. Its
Reuters Code
GMMP.BO
subsidiary- MAVAG also did quite well with 7% yoy growth in FY2018 revenue. Its
Bloomberg Code
GMM.IN
FY2019 opening order backlog is much higher than that of FY2018. Pharma
Shareholding Pattern (%)
sector share has come down from historical 50% to 30% of revenue. Orders from
Promoters
75.0
Pharma City is likely to pick up in the next 6-9 months.
MF / Banks / Indian Fls
0.4
Margins were decent: Operating margin were robust at 16.4% due to better
FII / NRIs / OCBs
0.1
product mix and cost optimization. MAVAG has almost tripled its FY2018 profits
Indian Public / Others
24.5
to ` 14 cr owing to better absorption of fixed cost. MAVAG is likely to sustain
Abs.(%)
3m 1yr
3yr
operating margin at ~17% level.
BSE 200
1.9
11.7
32.8
Outlook and Valuation: We have fine tuned our earnings estimates in view of
GMM Pfaudler
18.6
65.0
225.0
FY2018 results. We are expecting a CAGR of ~18%/20% in revenue/ earnings
over FY18-20E. The stock has given 21% return since our initiation in April and is
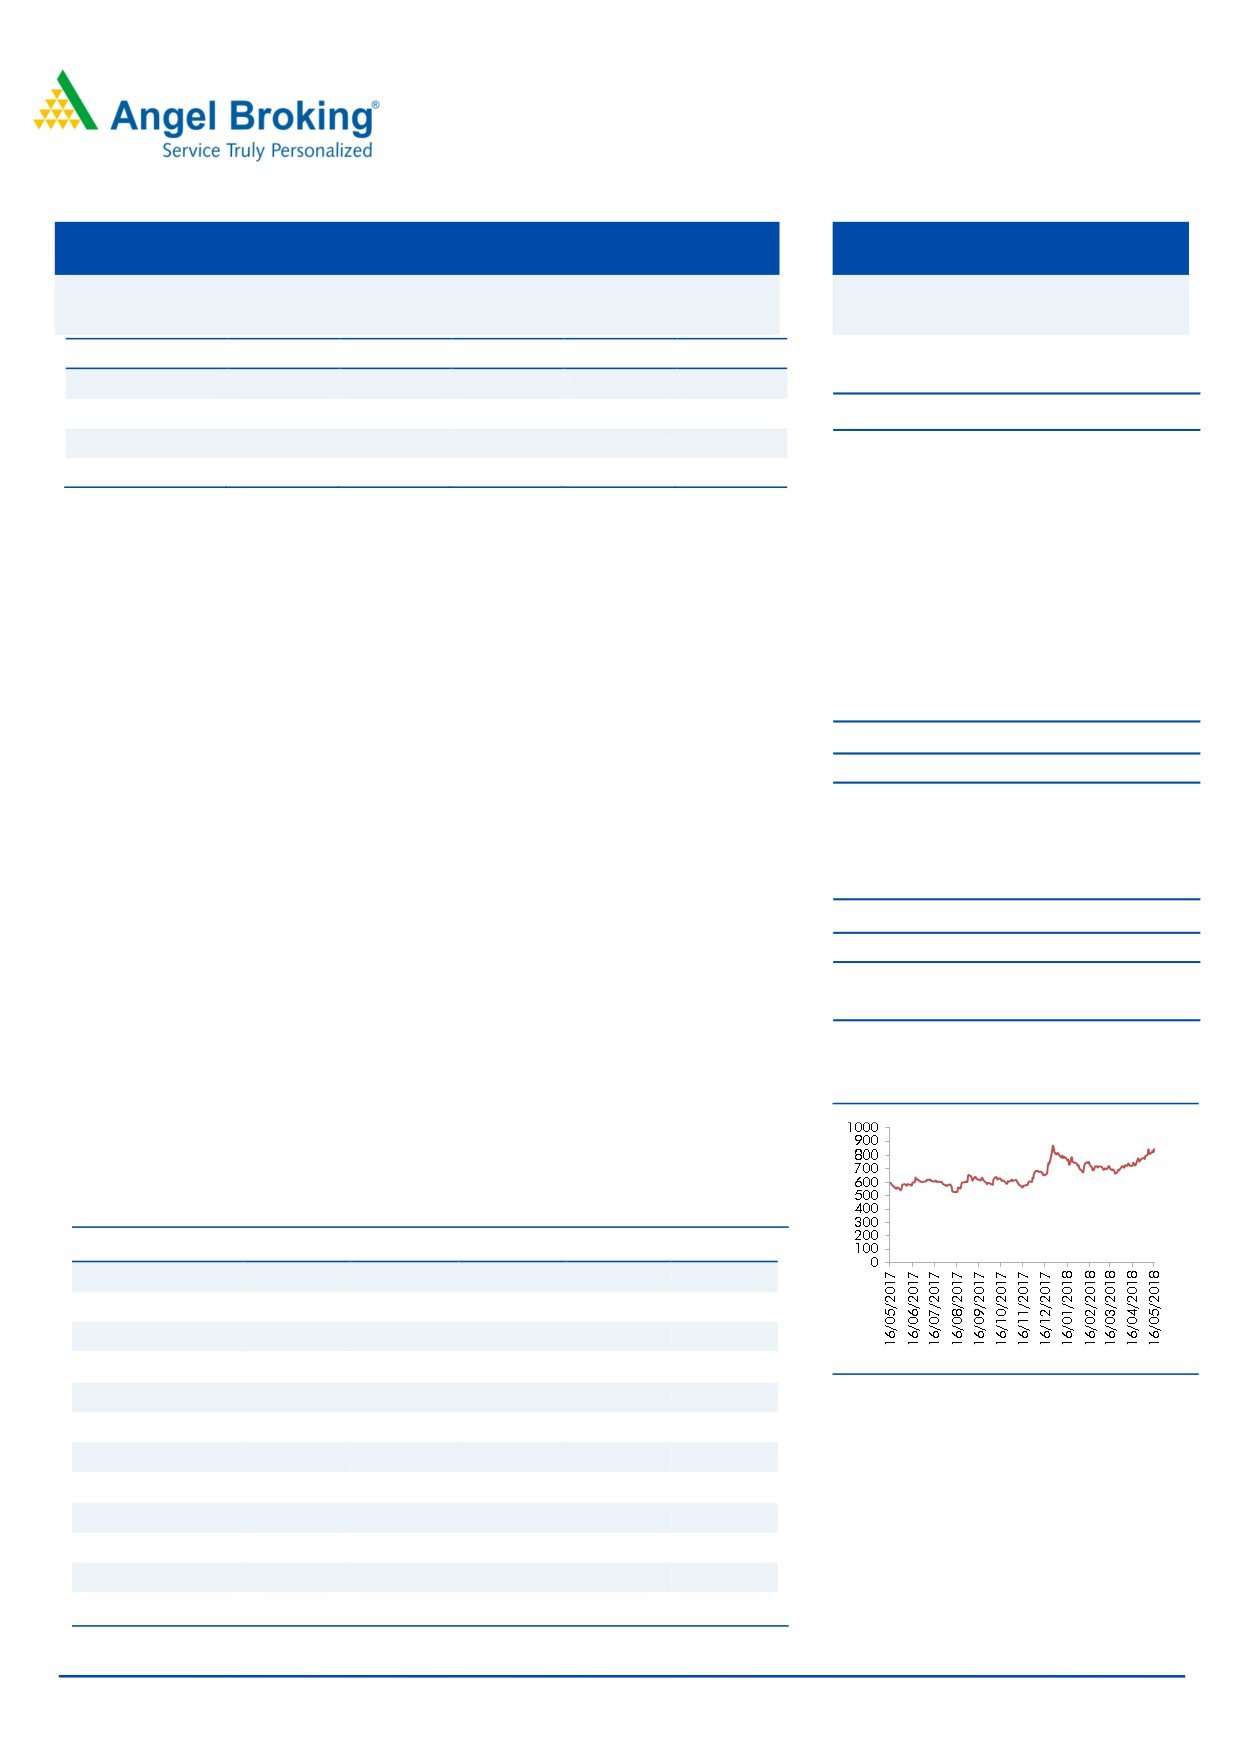
3-year price chart
currently trading at 20x its FY2020 earnings which largely trails its earnings
growth trajectory. Hence, we recommend Accumulate with a target price of `920
(22x FY2020E EPS).
Key Financials
Y/E March (` cr)
FY2016
FY2017
FY2018E
FY2019E
FY2020E
Net Sales
292.1
353.0
405.7
480.8
577.6
% chg
- 5.1
20.9
14.9
18.5
20.1
Net Profit
19.9
33.3
42.7
51.7
62.0
% chg
6.4
67.0
28.3
21.1
20.0
EBITDA (%)
12.0
13.5
15.3
15.8
15.8
EPS (Rs)*
13.6
22.8
29.2
35.4
42.5
Nidhi Agrawal
P/E (x)
63.4
38.0
29.6
24.4
20.4
022-39357800 Ext: 6872
P/BV (x)
7.6
6.5
5.5
4.6
3.9
RoE (%)
11.9
17.1
18.5
18.8
19.0
RoCE (%)
16.1
20.3
22.7
23.7
24.0
EV/EBITDA
34.2
24.9
18.8
15.1
12.3
EV/Sales
4.1
3.4
2.9
2.4
1.9
Source: Company, Angel Research
Please refer to important disclosures at the end of this report
1
GMM Pfaudler |4QFY2018 Result Update
Exhibit 1: Q4 results at a glance
Standalone results -` cr
Q 4FY18
Q 4FY17
YoY %
Q 3FY18
QoQ %
Net Sales
88
79
10.9%
79
10.9%
Raw Material Consumed
41
37
10.7%
38
7.2%
Stock Adjustment
-3
-1
332.2%
-6
-44.1%
Employee Expe nse s
10
9
6.6%
9
9.9%
Other Expenses
27
24
11.0%
26
1.3%
Total Expenditure
73
69
6.6%
67
9.8%
EBITDA
14
11
36.6%
12
16.9%
Other Income
2
1
76.6%
1
140.2%
Interest
0
0
-27.9%
0
13.3%
Depreciation
2
2
17.3%
2
7.7%
PBT
14
9
47.5%
11
28.3%
Tax
6
2
167.2%
4
57.4%
Profit After Tax
8
7
14.1%
7
14.4%
R atios
EBITDA margin
16.4%
13.3%
15.5%
PATmargin %
9.6%
9.3%
9.3%
Tax rate %
39.7%
21.9%
32.4%
Source: Company
Exhibit 2: Segmental performance
Standalone
C onsolidated
Subsidiaries
FY18
FY17
YO Y
FY18
FY17
YO Y
FY18
FY17
YO Y
Glass Lined Equipments
219
195
12%
219
195
12%
Heavy Engineering
37
47
-21%
37
47
-21%
Proprietary Products
62
49
26%
155
136
14%
93
87
7.6%
Non GL segment
99
96
3%
192
183
5%
93
87
7.6%
Total Segme nt Revenue
318
291
9%
411
378
9%
93
87
7.6%
A s a % of revenue
Glass Lined Equipments
69%
67%
53%
52%
Heavy Engineering
12%
16%
9%
12%
Proprietary Products
20%
17%
38%
36%
Non GL segment
31%
33%
47%
48%
Profit/Loss Before Interest and Tax
52
45
14%
68
52
31%
16
6
160%
Glass Lined Equipments
43
36
20%
43
36
20%
Heavy Engineering
4
7
-40%
4
7
-40%
Proprietary Products
5
3
49%
21
9
126%
16
6
167%
Non-GL segment
9
10
-12%
25
16
55%
16
6
167%
PBIT margin %
16.3%
15.6%
16.4%
13.6%
17.1%
7.1%
Glass-Lined segment
19.6%
18.3%
19.6%
18.3%
Heavy Engineering
10.9%
14.4%
10.9%
14.4%
Proprietary Products
7.5%
6.4%
13.2%
6.7%
17.1%
6.9%
Non-GL segment
8.8%
10.3%
12.8%
8.7%
17.1%
6.9%
Source: Company
May 18, 2018
2
GMM Pfaudler |4QFY2018 Result Update
Outlook and Valuation
We have fine tuned our earnings estimates in view of FY2018 results. We are
expecting a CAGR of ~18%/20% in revenue/ earnings over FY18-20E. The stock
has given 21% return since our initiation in April and is currently trading at 20x its
FY2020 earnings which largely trails the earnings growth trajectory. Hence, we
recommend Accumulate with a target price of `920 (22x FY2020E EPS).
Risks to our estimates
GMM’s primary raw material is steel; any abrupt fluctuation in pricing will
adversely impact its profitability.
Business may get impacted owing to the inability to get break through with
new clients or slowdown in capex by its clients.
GMM has market exposure to foreign exchange rates mainly on account
of exports, imports and investments in foreign subsidiary, and therefore, it
is subjected to the exchange fluctuation risk.
May 18, 2018
3
GMM Pfaudler |4QFY2018 Result Update
Profit & Loss Statement
Y/E March (`cr)
FY2016
FY2017
FY2018E
FY2019E
FY2020E
Total operating income
292.1
353.0
405.7
480.8
577.6
% chg
- 5.1
20.9
14.9
18.5
20.1
Total Expenditure
257.1
305.3
336.7
404.9
486.4
COGS
173.4
209.6
240.9
285.5
343.0
Selling and Administration Expenses
19.2
22.1
23.7
28.1
33.7
Personnel
56.2
66.1
63.5
81.7
98.2
Others Expenses
8.4
7.6
8.7
9.6
11.6
EBITDA
34.9
47.7
69.0
75.9
91.2
% chg
- 2.8
36.6
44.5
10.1
20.1
(% of Net Sales)
12.0
13.5
17.0
15.8
15.8
Depreciation& Amortisation
8.1
8.2
9.8
10.8
12.7
EBIT
26.8
39.5
59.2
65.1
78.5
% chg
2.7
47.3
49.8
10.1
20.5
(% of Net Sales)
9.2
11.2
14.6
13.5
13.6
Interest & other Charges
0.7
0.9
1.0
1.0
1.0
Other Income
3.6
8.3
9.4
10.8
12.4
(% of Sales)
1.2
2.3
2.3
2.2
2.1
Extraordinary Items
-
-
-
-
-
Share in profit of Associ ates
-
-
-
-
-
Recurring PBT
29.8
46.9
67.5
74.9
89.9
% chg
5.6
57.4
44.1
10.9
20.0
Tax
9.7
13.6
18.0
23.2
27.9
PAT (reported)
19.9
33.3
42.7
51.7
62.0
% chg
6.4
67.0
28.3
21.1
20.0
(% of Net Sales)
6.8
9.4
10.5
10.8
10.7
Basic & Fully Diluted EPS (Rs)
13.6
22.8
29.2
35.4
42.5
% chg
6.4
67.0
28.3
21.1
20.0
May 18, 2018
4
GMM Pfaudler |4QFY2018 Result Update
Consolidated Balance Sheet
Y/E March (` cr)
FY2016
FY2017
FY2018E FY2019E FY2020E
SOURCES OF FUNDS
Equity Share Capital
2.9
2.9
2.9
2.9
2.9
Reserves& Surplus
163.9
191.9
227.9
271.5
323.8
Shareholders Funds
166.8
194.8
230.8
274.4
326.8
Minority Interest
-
-
-
-
-
Total Loans
-
-
-
-
-
Other Liab & Prov
4.4
11.1
11.6
12.1
12.8
Total Liabilities
171.3
205.9
242.4
286.6
339.6
APPLICATION OF FUNDS
Net Block
53.4
61.2
66.4
70.6
72.9
Capital Work-in-Progress
4.3
2.0
2.0
2.0
2.0
Investments
13.7
44.6
64.6
84.6
94.6
Curre nt Assets
178.6
207.9
233.2
269.4
338.3
Inventories
70.9
82.3
94.5
112.0
134.6
Sundry De btors
48.7
69.9
80.3
95.2
114.4
Cash
53.6
31.7
30.6
29.3
49.9
Loans & Advances
5.5
24.1
27.7
32.8
39.4
Other Assets
-
-
-
-
-
Current liabilities
84.4
113.2
127.9
144.9
174.1
Net Current Assets
94.2
94.7
105.3
124.5
164.2
Other Non Current Asset
5.6
3.4
4.1
4.8
5.8
Total Assets
171.3
205.9
242.4
286.6
339.6
May 18, 2018
5
GMM Pfaudler |4QFY2018 Result Update
Consolidated Cashflow Statement
Y/E March (`cr)
FY2016
FY2017
FY2018E FY2019E FY2020E
Profit before tax
29.8
46.9
60.7
74.9
89.9
Depreciation
8.1
8.2
9.8
10.8
12.7
Change in Working Capital
(2.0)
(12.8)
(9.7)
(20.5)
(19.2)
Interest / Dividend (Net)
-
-
-
-
-
Direct taxes paid
(9.6)
(14.0)
(18.0)
(23.2)
(27.9)
Others
1.8
5.3
-
-
-
C ash Flow from Operati ons
24.7
23.0
42.8
42.0
55.6
(Inc.)/ Dec. i n Fixed Assets
(13.9)
(14.4)
(15.0)
(15.0)
(15.0)
(Inc.)/ Dec. i n Inve stments
0.3
0.1
-
-
-
C ash Flow from Inve sting
(17.0)
(22.0)
(36.9)
(35.4)
(25.5)
Issue of Equity
-
-
-
-
-
Inc./(Dec.) in loans
-
-
-
-
-
Others
6.0
6.3
6.7
8.1
9.7
C ash Flow from Financing
(6.0)
(6.3)
(6.7)
(8.1)
(9.7)
Inc./(Dec.) in Cash
1.7
(5.3)
(0.8)
(1.5)
20.4
O pening Cash balance s
34.7
36.4
31.1
30.3
28.8
Closing Cash balances
36.4
31.1
30.3
28.8
49.2
May 18, 2018
6
GMM Pfaudler |4QFY2018 Result Update
Key Ratios
Y/E March
FY16
FY17
FY18E
FY19E
FY20E
Valuati on Ratio (x)
P/E (on FDEPS)
63.4
38.0
29.6
24.4
20.4
P/CEPS
33.9
22.2
17.5
14.6
12.2
P/BV
7.6
6.5
5.5
4.6
3.9
Dividend yield (%)
0.3
0.5
0.5
0.5
0.6
EV/Sales
4.1
3.4
2.9
2.4
1.9
EV/EBITDA
34.2
24.9
18.8
15.1
12.3
EV / Total Assets
7.0
5.8
4.8
4.0
3.3
Per Share Data (Rs)
EPS (Basic)
13.6
22.8
29.2
35.4
42.5
EPS (fully diluted)
13.6
22.8
29.2
35.4
42.5
Cash EPS
25.5
38.9
49.4
59.1
70.7
DPS
3.0
4.0
4.0
4.6
5.5
Book Value
114.3
133.4
158.1
188.0
223.8
Returns (%)
ROCE
16.1
20.3
22.7
23.7
24.0
Angel ROIC (Pre-tax)
25.8
30.5
35.5
37.7
40.3
ROE
11.9
17.1
18.5
18.8
19.0
Turnover rati os (x)
Asset Turnover (Gross Block)
2.6
3.1
3.2
3.4
3.7
Inventory / Sales (days)
89
85
85
85
85
Receivables (days)
61
72
72
72
72
Payable s (days)
101
115
115
110
110
WC cycle (ex-cash) (days)
48
42
42
47
47
Source: Company, Angel Research
May 18, 2018
7
GMM Pfaudler |4QFY2018 Result Update
Research Team Tel: 022 - 39357800
DISCLAIMER
This document is solely for the personal information of the recipient, and must not be singularly used as the basis of any investment
decision. Nothing in this document should be construed as investment or financial advice. Each recipient of this document sho uld
make such investigations as they deem necessary to arrive at an independent evaluation of an investment in the securities of the
companies referred to in this document (including the merits and risks involved), and should consult their own advisors to de termine
the merits and risks of such an investment.
Angel Broking Pvt. Limited, its affiliates, directors, its proprietary trading and investment businesses may, from time to time, make
investment decisions that are inconsistent with or contradictory to the recommendations expressed herein. The views contained in this
document are those of the analyst, and the company may or may not subscribe to all the views expressed within.
Reports based on technical and derivative analysis center on studying charts of a stock's price movement, outstanding positio ns and
trading volume, as opposed to focusing on a company's fundamentals and, as such, may not match with a report on a company's
fundamentals.
The information in this document has been printed on the basis of publicly available information, internal data and other reliable
sources believed to be true, but we do not represent that it is accurate or complete and it should not be relied on as such, as this
document is for general guidance only. Angel Broking Pvt. Limited or any of its affiliates/ group companies shall not be in any way
responsible for any loss or damage that may arise to any person from any inadvertent error in the information contained in th is report.
Angel Broking Pvt. Limited has not independently verified all the information contained within this document. Accordingly, we cannot
testify, nor make any representation or warranty, express or implied, to the accuracy, contents or data contained within this document.
While Angel Broking Pvt. Limited endeavours to update on a reasonable basis the information discussed in this material, there may be
regulatory, compliance, or other reasons that prevent us from doing so.
This document is being supplied to you solely for your information, and its contents, information or data may not be reproduc ed,
redistributed or passed on, directly or indirectly.
Angel Broking Pvt. Limited and its affiliates may seek to provide or have engaged in providing corporate finance, investment banking
or other advisory services in a merger or specific transaction to the companies referred to in this report, as on the date of this report or
in the past.
Neither Angel Broking Pvt. Limited, nor its directors, employees or affiliates shall be liable for any loss or damage that ma y arise from
or in connection with the use of this information.
Note: Please refer to the important `Stock Holding Disclosure' report on the Angel website (Research Section). Also, please r efer to the
latest update on respective stocks for the disclosure status in respect of those stocks. Angel Broking Pvt. Limited and its affiliates may
have investment positions in the stocks recommended in this report.
Disclosure of Interest Statement
GMM Pfaudler
1. Analyst ownership of the stock
No
2. Angel and its Group companies ownership of the stock
No
3. Angel and its Group companies' Directors ownership of the stock
No
4. Broking relationship with company covered
No
Note: We have not considered any Exposure below ` 1 lakh for Angel, its Group companies and Directors
Ratings (Returns):
Buy (> 15%)
Accumulate (5% to 15%)
Neutral (-5 to 5%)
Reduce (-5% to -15%)
Sell (< -15%)
May 18, 2018
8